Enquire Now
Data Science Course
Online & Classroom Training
with Placement Assistance
Become a Data Scientist in 6 Months
Learn Python, SQL, Machine Learning, Deep Learning, Generative AI, Agentic AI & Power BI with Industry Projects
NASSCOM FutureSkills Prime Certified Program
- 500+ Batches Delivered
- Internship Included
- Live Instructor-Led Training
- 10+ Real-Time Projects
Talk to our career expert


Tools & Technologies Covered


NASSCOM Futureskills Prime Certified
Data Science Course Curriculum
Module 1: Python Core and Advanced
INTRODUCTION
- What is Python?
- Why does Data Science require Python?
- Installation of Anaconda
- Understanding Jupyter Notebook
- Basic commands in Jupyter Notebook
- Understanding Python Syntax
Data Types and Data Structures
- Variables and Strings
- Lists, Sets, Tuples, and Dictionaries
Control Flow and Conditional Statements
- Conditional Operators, Arithmetic Operators, and Logical Operators
- If, Elif and Else Statements
- While Loops
- For Loops
- Nested Loops and List and Dictionary Comprehensions
Functions
- What is function and types of functions
- Code optimization and argument functions
- Scope
- Lambda Functions
- Map, Filter, and Reduce
File Handling
- Create, Read, Write files and Operations in File Handling
- Errors and Exception Handling
Class and Objects
- Create a class
- Create an object
- The __init__()
- Modifying Objects
- Object Methods
- Self
- Modify the Object Properties
- Delete Object
- Pass Statements
Module 2: Exploratory Data Analysis using Python
Numpy – NUMERICAL PYTHON
- Introduction to Array
- Creation and Printing of an array
- Basic Operations in Numpy
- Indexing
- Mathematical Functions of Numpy
2. Data Manipulation with Pandas
- Series and DataFrames
- Data Importing and Exporting through Excel, CSV Files
- Data Understanding Operations
- Indexing and slicing and More filtering with Conditional Slicing
- Group by, Pivot table, and Cross Tab
- Concatenating and Merging Joining
- Descriptive Statistics
- Removing Duplicates
- String Manipulation
- Missing Data Handling
DATA VISUALIZATION
Data Visualization using Matplotlib and Pandas
- Introduction to Matplotlib
- Basic Plotting
- Properties of plotting
- About Subplots
- Line plots
- Pie chart and Bar Graph
- Histograms
- Box and Violin Plots
- Scatterplot
Case Study on Exploratory Data Analysis (EDA) and Visualizations
- What is EDA?
- Uni – Variate Analysis
- Bi-Variate Analysis
- More on Seaborn based Plotting Including Pair Plots, Catplot, Heat Maps, Count plot along with matplotlib plots.
UNSTRUCTURED DATA PROCESSING
Regular Expressions
- Structured Data and Unstructured Data
- Literals and Meta Characters
- How to Regular Expressions using Pandas?
- Inbuilt Methods
- Pattern Matching
PROJECT ON WEB SCRAPING: DATA MINING and EXPLORATORY DATA ANALYSIS
- Data Mining (WEB – SCRAPING)
This project starts completely from scratch which involves the collection of Raw Data from different sources and converting the unstructured data to a structured format to apply Machine Learning and NLP models. This project covers the main four steps of the Data Science Life Cycle which involves.- Data Collection
- Data Mining
- Data Preprocessing
- Data Visualization
Ex: Text, CSV, TSV, Excel Files, Matrices, Images
Module 3: Advanced Statistics
Data Types and Data Structures
- Statistics in Data science:
- What is Statistics?
- How is Statistics used in Data Science?
- Population and Sample
- Parameter and Statistic
- Variable and its types
Data Gathering Techniques
- Data types
- Data Collection Techniques
- Sampling Techniques:
- Convenience Sampling, Simple Random Sampling
- Stratified Sampling, Systematic Sampling, and Cluster Sampling
Descriptive Statistics
- What is Univariate and Bi Variate Analysis?
- Measures of Central Tendencies
- Measures of Dispersion
- Skewness and Kurtosis
- Box Plots and Outliers detection
- Covariance and Correlation
Probability Distribution
- Probability and Limitations
- Discrete Probability Distributions
- Bernoulli, Binomial Distribution, Poisson Distribution
- Continuous Probability Distributions
- Normal Distribution, Standard Normal Distribution
Inferential Statistics
- Sampling variability and Central Limit Theorem
- Confidence Intervals
- Hypothesis Testing
- Z-test, T-test
- Chi-Square Test
- F-Test and ANOVA
Your content goes here. Edit or remove this text inline or in the module Content settings. You can also style every aspect of this content in the module Design settings and even apply custom CSS to this text in the module Advanced settings.
Module 4. SQL for Data Analysis
Introduction to Databases
Basics of SQL
- DML, DDL, DCL, and Data Types
- Common SQL commands using SELECT, FROM, and WHERE
- Logical Operators in SQL
SQL Joins
- INNER and OUTER joins to combine data from multiple tables
- RIGHT, LEFT joins to combine data from multiple tables
Filtering and Sorting
- Advanced filtering using IN, OR, and NOT
- Sorting with GROUP BY and ORDER BY
SQL Aggregations
- Common Aggregations including COUNT, SUM, MIN, and MAX
- CASE and DATE functions as well as work with NULL values
Subqueries and Temp Tables
- Subqueries to run multiple queries together
- Temp tables to access a table with more than one query
SQL Data Cleaning
- Perform Data Cleaning using SQL
Module 5: Machine Learning Supervised Learning
INTRODUCTION
- What Is Machine Learning?
- Supervised Versus Unsupervised Learning
- Regression Versus Classification Problems Assessing Model Accuracy
REGRESSION TECHNIQUES
Linear Regression
- Simple Linear Regression:
- Estimating the Coefficients
- Assessing the Coefficient Estimates
- R Squared and Adjusted R Squared
- MSE and RMSE
Multiple Linear Regression
- Estimating the Regression Coefficients
- OLS Assumptions
- Multicollinearity
- Feature Selection
- Gradient Descent
Evaluating the Metrics of Regression Techniques
- Homoscedasticity and Heteroscedasticity of error terms
- Residual Analysis
- Q-Q Plot
- Cook’s distance and Shapiro-Wilk Test
- Identifying the line of best fit
- Other Considerations in the Regression Model
- Qualitative Predictors
- Interaction Terms
- Non-linear Transformations of the Predictors
Polynomial Regression
- Why Polynomial Regression
- Creating polynomial linear regression
- Evaluating the metrics
Regularization Techniques
- Lasso Regularization
- Ridge Regularization
- ElasticNet Regularization
- Case Study on Linear, Multiple Linear Regression, Polynomial, Regression using Python
CAPSTONE PROJECT: A project on a use case will challenge the Data Understanding, EDA, Data Processing, and above Regression Techniques.
CLASSIFICATION TECHNIQUES
Logistic regression
- An Overview of Classification
- Difference Between Regression and classification Models.
- Why Not Linear Regression?
- Logistic Regression:
- The Logistic Model
- Estimating the Regression Coefficients and Making Predictions
- Logit and Sigmoid functions
- Setting the threshold and understanding decision boundary
- Logistic Regression for >2 Response Classes
- Evaluation Metrics for Classification Models:
- Confusion Matrix
- Accuracy and Error rate
- TPR and FPR
- Precision and Recall, F1 Score
- AUC-ROC
- Kappa Score
Naive Bayes
- Principle of Naive Bayes Classifier
- Bayes Theorem
- Terminology in Naive Bayes
- Posterior probability
- Prior probability of class
- Likelihood
- Types of Naive Bayes Classifier
- Multinomial Naive Bayes
- Bernoulli Naive Bayes and Gaussian Naive Bayes
TREE BASED MODULES
Decision Trees
- Decision Trees (Rule-Based Learning):
- Basic Terminology in Decision Tree
- Root Node and Terminal Node
- Regression Trees and Classification Trees
- Trees Versus Linear Models
- Advantages and Disadvantages of Trees
- Gini Index
- Overfitting and Pruning
- Stopping Criteria
- Accuracy Estimation using Decision Trees
Case Study: A Case Study on Decision Tree using Python
- Resampling Methods:
- Cross-Validation
- The Validation Set Approach Leave-One-Out Cross-Validation
- K-Fold Cross-Validation
- Bias-Variance Trade-O for K-Fold Cross-Validation
Ensemble Methods in Tree-Based Models
- What is Ensemble Learning?
- What is Bootstrap Aggregation Classifiers and how does it work?
Random Forest
- What is it and how does it work?
- Variable selection using Random Forest
Boosting: AdaBoost, Gradient Boosting
- What is it and how does it work?
- Hyper parameter and Pro’s and Con’s
Case Study: Ensemble Methods – Random Forest Techniques using Python
DISTANCE BASED MODULES
K Nearest Neighbors
- K-Nearest Neighbor Algorithm
- Eager Vs Lazy learners
- How does the KNN algorithm work?
- How do you decide the number of neighbors in KNN?
- Curse of Dimensionality
- Pros and Cons of KNN
- How to improve KNN performance
Case Study: A Case Study on KNN using Python
Support Vector Machines
- The Maximal Margin Classifier
- HyperPlane
- Support Vector Classifiers and Support Vector Machines
- Hard and Soft Margin Classification
- Classification with Non-linear Decision Boundaries
- Kernel Trick
- Polynomial and Radial
- Tuning Hyper parameters for SVM
- Gamma, Cost, and Epsilon
- SVMs with More than Two Classes
Case Study: A Case Study on SVM using Python
CAPSTONE PROJECT: A project on a use case will challenge the Data Understanding, EDA, Data Processing, and above Classification Techniques.
Module 6: Machine Learning Unsupervised Learning
- Why Unsupervised Learning
- How it Different from Supervised Learning
- The Challenges of Unsupervised Learning
Principal Components Analysis
- Introduction to Dimensionality Reduction and its necessity
- What Are Principal Components?
- Demonstration of 2D PCA and 3D PCA
- Eigen Values, EigenVectors, and Orthogonality
- Transforming Eigen values into a new data set
- Proportion of variance explained in PCA
Case Study: A Case Study on PCA using Python
K-Means Clustering
- Centroids and Medoids
- Deciding the optimal value of ‘K’ using Elbow Method
- Linkage Methods
Hierarchical Clustering
- Divisive and Agglomerative Clustering
- Dendrograms and their interpretation
- Applications of Clustering
- Practical Issues in Clustering
Case Study: A Case Study on clusterings using Python
CAPSTONE PROJECT: A project on a use case will challenge Data Understanding, EDA, Data Processing, and Unsupervised algorithms.
RECOMMENDATION SYSTEMS
- What are recommendation engines?
- How does a recommendation engine work?
- Data collection
- Data storage
- Filtering the data
- Content-based filtering
- Collaborative filtering
- Cold start problem
- Matrix factorization
- Building a recommendation engine using matrix factorization
- Case Study
Module 7: Artificial Intelligence and Deep Learning
Introduction to Neural Networks
- Introduction to Perceptron & History of Neural networks
- Activation functions
- a)Sigmoid b)Relu c)Softmax d)Leaky Relu e)Tanh
- Gradient Descent
- Learning Rate and tuning
- Optimization functions
- Introduction to Tensorflow
- Introduction to Keras
- Backpropagation and chain rule
- Fully connected layer
- Cross entropy
- Weight Initialization
- Regularization
TensorFlow 2.0
- Introducing Google Colab
- Tensorflow basic syntax
- Tensorflow Graphs
- Tensorboard
Artificial Neural Network with Tensorflow
- Neural Network for Regression
- Neural Network for Classification
- Evaluating the ANN
- Improving and tuning the ANN
- Saving and Restoring Graphs
Your content goes here. Edit or remove this text inline or in the module Content settings. You can also style every aspect of this content in the module Design settings and even apply custom CSS to this text in the module Advanced settings.
Module 8: Computer Vision (CV)
Working with images & CNN Building Blocks
- Working with Images_Introduction
- Working with Images – Reshaping understanding, size of image understanding pixels Digitization,
- Sampling, and Quantization
- Working with images – Filtering
- Hands-on Python Demo: Working with images
- Introduction to Convolutions
- 2D convolutions for Images
- Convolution – Backward
- Transposed Convolution and Fully Connected Layer as a Convolution
- Pooling: Max Pooling and Other pooling options
CNN Architectures and Transfer Learning
- CNN Architectures and LeNet Case Study
- Case Study: AlexNet
- Case Study: ZFNet and VGGNet
- Case Study: GoogleNet
- Case Study: ResNet
- GPU vs CPU
- Transfer Learning Principles and Practice
- Hands-on Keras Demo: SVHN Transfer learning from MNIST dataset
- Transfer learning Visualization (run package, occlusion experiment)
- Hands-on demo T-SNE
Object Detection
- CNN’s at Work – Object Detection with region proposals
- CNN’s at Work – Object Detection with Yolo and SSD
- Hands-on demo- Bounding box regressor
- #Need to do a semantic segmentation project
CNN’s at Work – Semantic Segmentation
- CNNs at Work – Semantic Segmentation
- Semantic Segmentation process
- U-Net Architecture for Semantic Segmentation
- Hands-on demo – Semantic Segmentation using U-Net
- Other variants of Convolutions
- Inception and MobileNet models
CNN’s at work- Siamese Network for Metric Learning
- Metric Learning
- Siamese Network as metric learning
- How to train a Neural Network in Siamese way
- Hands-on demo – Siamese Network
Module 9: Natural Language Processing (NLP)
Introduction to Statistical NLP Techniques
- Introduction to NLP
- Preprocessing, NLP Tokenization, stop words, normalization, Stemming and lemmatization
- Preprocessing in NLP Bag of words, TF-IDF as features
- Language model probabilistic models, n-gram model, and channel model
- Hands-on NLTK
Word Embedding
- Word2vec
- Golve
- POS Tagger
- Named Entity Recognition(NER)
- POS with NLTK
- TF-IDF with NLTK
Sequential Models
- Introduction to sequential models
- Introduction to RNN
- Introduction to LSTM
- LSTM forward pass
- LSTM backdrop through time
- Hands-on Keras LSTM
Applications
- Sentiment Analysis
- Sentence generation
- Machine translation
- Advanced LSTM structures
- Keras – machine translation
- ChatBot
Module 10: Power BI
Introduction To Power Bi
What is Business Intelligence?
- Power BI Introduction
- Quadrant report
- Comparison with other BI tools
- Power BI Desktop overview
- Power BI workflow
- Installation query addressal
Data Import And Visualizations
- Data import options in Power BI
- Import from Web (hands-on)
- Why Visualization?
- Visualization types
Data Visualization (Contd.)
Categorical data visualization
Visuals for Filtering
Slicer details and use
Formatting visuals
KPI visuals
Tables and Matix
Power Queries
- Power Query Introduction
- Data Transformation – its benefits
- Queries panel
- M Language briefing
- Power BI Datatypes
- Changing Datatypes of columns
Power Queries (Cond.)
- Filtering
- Inbuilt column Transformations
- Inbuilt row Transformations
- Combine Queries
- Merge Queries
Power Pivot And Introduction To Dax
- Power Pivot
- Intro to Data Modelling
- Relationship and Cardinality
- Relationship view
- Calculated Columns vs Measures
- DAX Introduction and Syntax
Online Training
- Attend Live Classes from Home
- Remote Internship
- Online Mentoring
- job fitment assessment
- Project Presentations
- Placement Assistance
Classroom Training
- Attend Sessions at Our Campuses in Hyderabad (JNTU & Dilsukhnagar), Bangalore & Pune
- Industry Internship
- In-Person Mentoring
- job fitment assessment
- Project Presentations
- Placement Assistance
Industry Training with Placement Assistance
Industry-Ready Training
Practical, job-focused curriculum designed as per current industry standards.

Submit Assignments
Regular hands-on assignments to strengthen concepts and practical skills.

GitHub & Resume Preparation
Build a strong GitHub portfolio and ATS-friendly professional resume.

Mock Interviews
Practice real interview scenarios with expert feedback.
Aptitude Training
Improve logical reasoning, quantitative, and problem-solving skills.

Soft Skills Training
Enhance communication, presentation, and workplace readiness skills.

Placement Support
Dedicated career assistance with job referrals and interview opportunities.
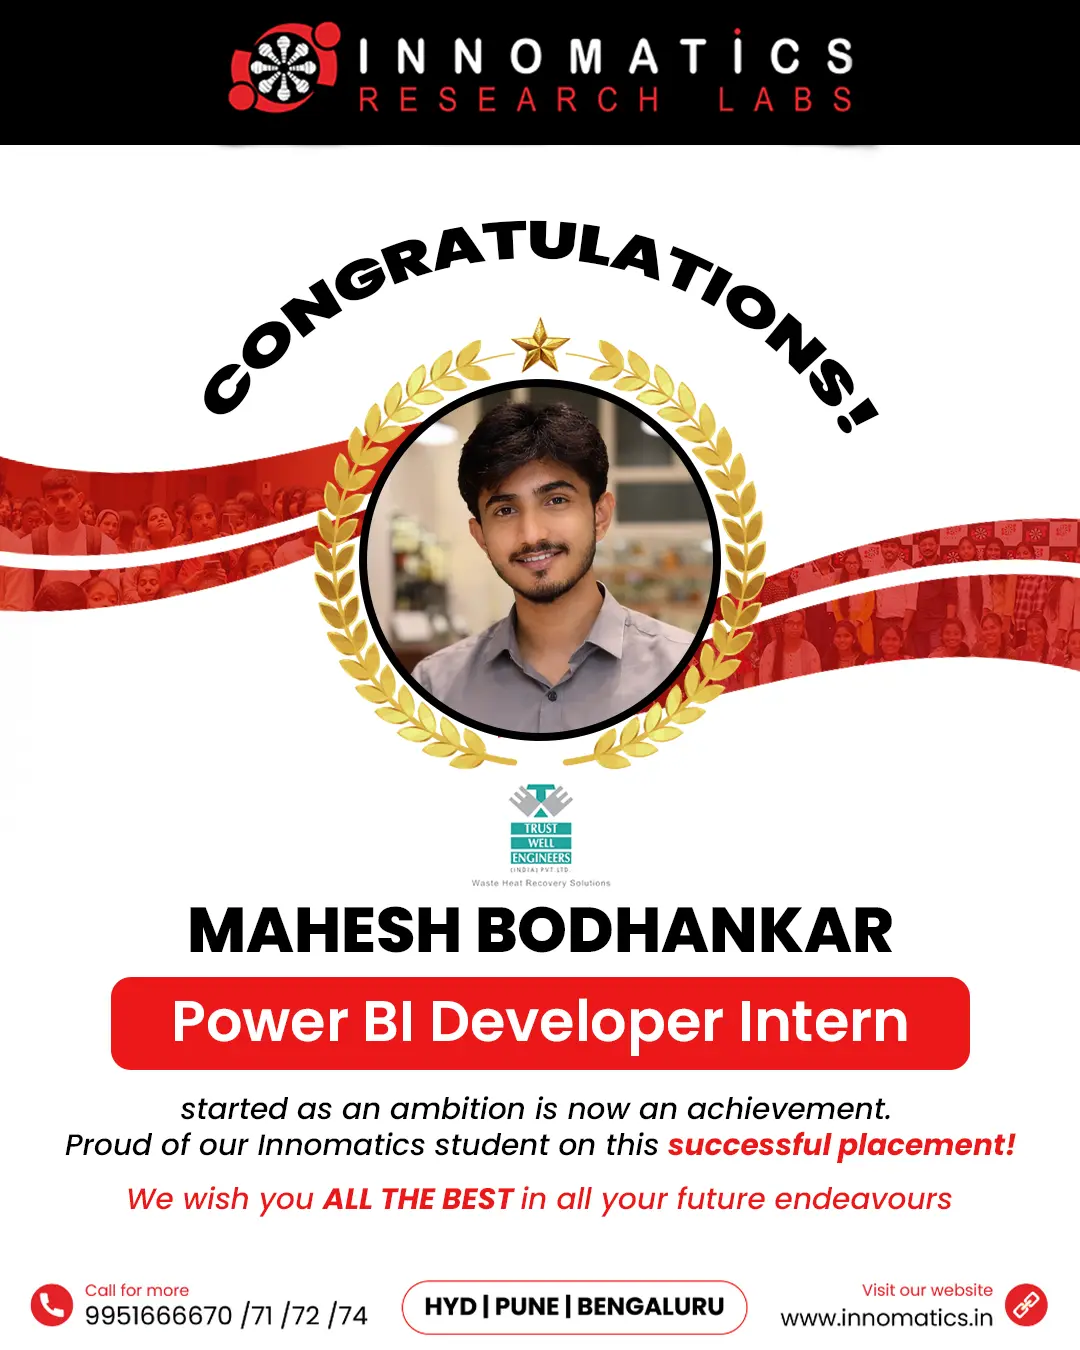
Success Stories of Innomatics Alumni


Career Opportunities after the Data Science Course
$28.36 billion
growth of the AI market by 2030
20 million
new AI-related roles by 2030
10,000+
Careers Transformed
- Data Scientist
- AI Engineer
- NLP Engineer
- AI Consultant
- Data Engineer
- Data Analyst
- GenAI Engineer
- Business Analyst
- ML Engineer
- Big Data Engineer
Industry-Recognized Certification’s
Course Completion Certificate

Internship Certificate

What Our Data Science Students Say About Innomatics
General Queries & Answers
What will I learn in NASSCOM FutureSkills Prime certified Data Science?
In Data Science, you will learn how to find valuable data, analyze and apply mathematical skills to it to use in business for making great decisions, developing a product, forecasting, and building business strategies.
What is the average salary of a Data Scientist?
In India, Data Scientist salaries vary widely, typically ranging from ₹3 LPA to ₹20 LPA, depending on skills and experience. Here’s a quick breakdown:
- Data Analyst: ₹3–7 LPA
- Junior Data Scientist: ₹6–9 LPA
- Data Scientist: ₹10–15 LPA
Are there any prerequisites to learn the Data Science course?
One need not have any major knowledge in Data Science. A basic understanding of technology is all enough to get started. It is better to possess knowledge of mathematical and communication skills, Python, R, and SAS tools.
What are my takeaways after completion of the Data Science course?
Based on the program you choose, you will get a course completion certificate from Innomatics. Mastery-level certification from NASSCOM FutureSkills Prime.
What are the career opportunities in Data Science Technology?
As data has become the never-ending part of this world, businesses need people to work with data for effective business processing. Organizations are ready to recruit and pay top dollars to the right dollars, which can leverage the business.
Here are some of the roles you can find in Data Science
- Research Analyst
- Data Scientist
- Data Analyst
- Big Data Analytics Specialist
- Business Analyst Consultant / Manager
- Data analyst
If I study Data Science course in Hyderabad, is placement guaranteed?
Apart from the training, we do provide placement and career assistance with capstone projects and hands-on training after completing the course successfully. We do offer internship programs, mockup interviews, hackathons to gain more knowledge and explore a wide range of job opportunities.
Will I get any career support after the Data Science training?
All our trainees will have access to the Learning Management System (LMS), where they can get the backup classes and stay updates, 1-1 interviews, continuous updates on placements, and hackathons.
What is the eligibility criteria to learn Data Science course?
Anyone who has a bachelor’s degree, a passion for data science, and little knowledge of it are eligibility criteria for the Data Science Course.